Charts & Infographics
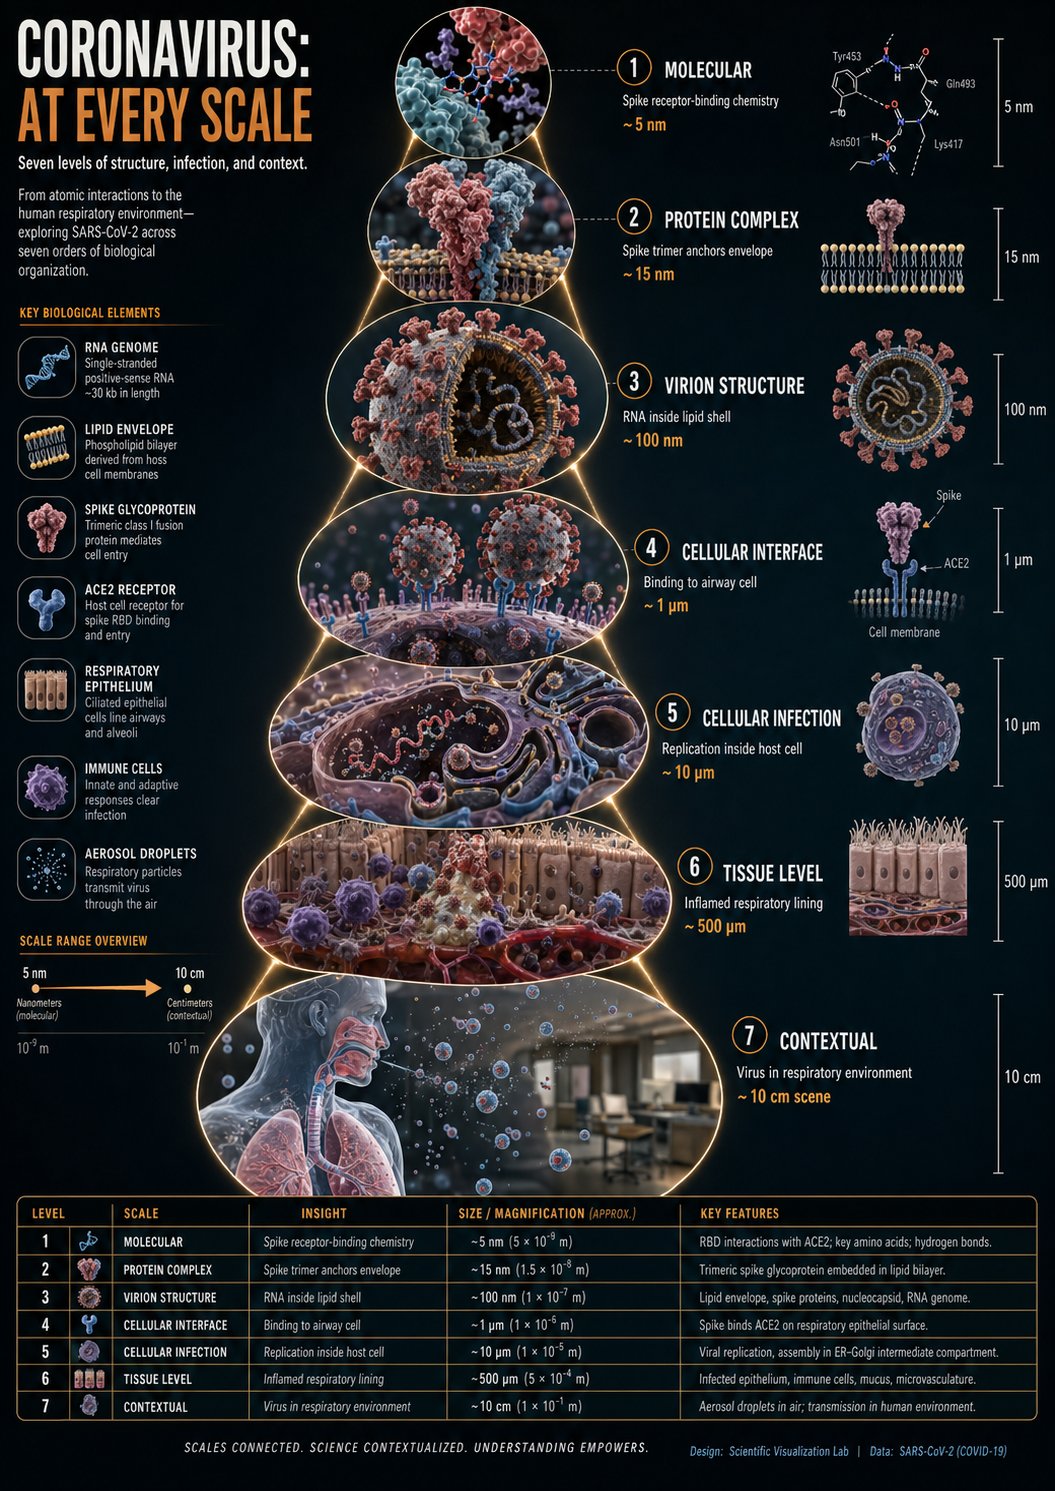
冠状病毒尺度缩放科学信息图
用于信息图生成,主体为冠状病毒尺度缩放科学信息图。重点强调写实质感、结构化信息表达、拼贴分镜构图。
#Charts & Infographics#Infographic#Realistic#3D#Tech#Story
作者@Gdgtify来源链接https://x.com/Gdgtify/status/2051288232613351571
Prompt 模板
instructions> [SUBJECT]=Coronavirus. A hyper-realistic 3D zoom-sequence infographic generated from a single input: [SUBJECT]. The system auto-detects scale layers from atomic/subcomponent to full contextual view. Layout Structure (CRITICAL) 6–8 circular or hexagonal frames arranged in expanding sequence Innermost frame = smallest detectable detail; outermost = full subject in environment Frames connected by subtle zoom-path lines No repeated scales — each frame shows new level of detail Frame Design Each zoom level includes: Hyper-detailed 3D render at that scale Micro label: scale name (e.g., "molecular," "cellular," "structural") + 3–5 word insight Optional: measurement tag or magnification factor Contextual Halo Around the sequence, include only scale-specific references: Measurement units, scientific notation, cultural scale metaphors (No generic magnifying glass icons) Scale Panel (Alternative Layout) Zoom level Key insight (3–5 words) Scale factor tag Detail icon (grid, wave, particle, etc.) Title "[SUBJECT]: AT EVERY SCALE" (or) "ZOOM: THE WORLD OF [SUBJECT]" Style: ultra-realistic 3D render, scientific editorial infographic, precise macro lighting, global illumination, shallow depth of field, clean sequential layout. </instructions>
画廊