Charts & Infographics
信息图可视化设计
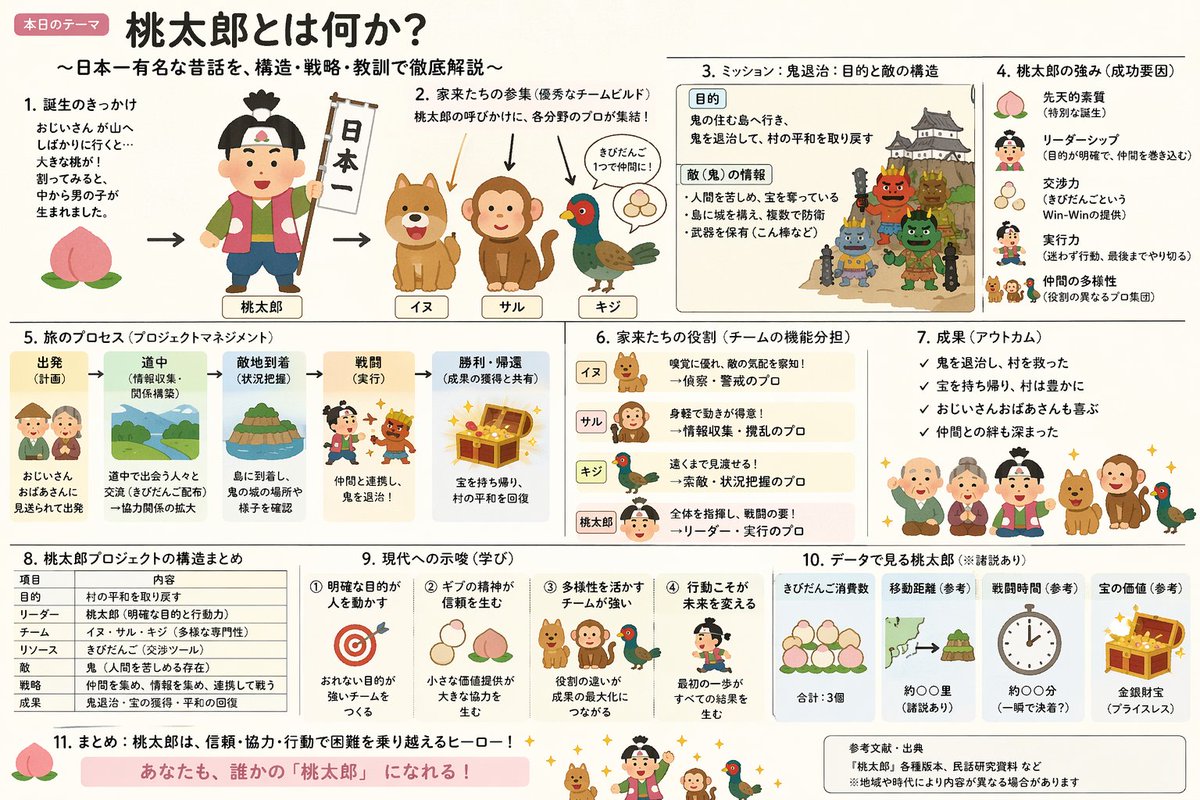
用于信息图生成,主体为信息图可视化设计。
#Charts & Infographics#Infographic#3D#Creative
Author@yammamonSource URLhttps://x.com/yammamon
Prompt Template
Create an explanatory slide ({argument name="format" default="ponchi-e diagram"}) for {argument name="theme" default="Momotaro"} that fuses the gentle atmosphere of "Irasutoya" with the overwhelming information density of "Kasumigaseki slides".Gallery